Recent Posts
Bare Amperometric Sensor vs. Membrane Sensor Technology
Looking to measure oxidant in an application that frequently shuts down and starts up? Want to reduce the impact of flow and pressure changes on your oxidant measurement system? Switching from a membrane-style amperometric measurement system gives you these benefits and more. Watch our new video to learn about Kuntze's bare amperometric sensors and how they outperform membrane sensor technology.
Were you looking to compare Kuntze systems to online colorimetric sensor technologies? Click here to learn more.
The Purpose of Calibration
Amperometric sensors work by taking an electrical signal and translating it to a concentration. The graphic below illustrates this process.

First, the analyte of interest (chlorine, chlorine dioxide, ozone, etc.) gets reduced on the measuring electrode of the sensor. This generates a raw electrical signal, measured in millivolts (mV). This signal gets processed by the Neon® analyzer, which uses your pH, calibration slope, temperature, and other parameters to turn the mV signal into a concentration value, usually measured in ppm or ppb. This concentration is what gets displayed on the Neon® unit.
In order for the analyzer to make the conversion between an electrical signal to a concentration, a calibration must be performed. A calibration tells the analyzer "an electrical signal of ___ mV corresponds to a disinfectant concentration of ___ ppm" where the disinfectant concentration is measured with a reference method such as DPD. This process is shown below.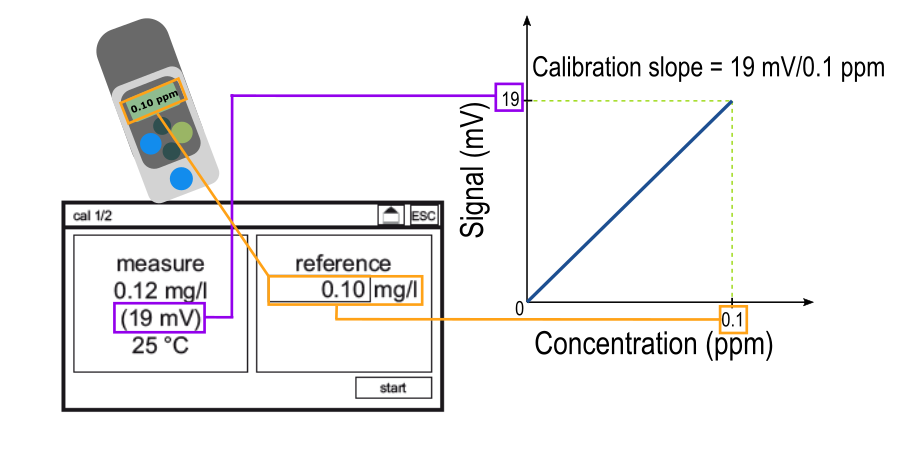
Inputting a reference value on the calibration screen generates a calibration slope. For each measuring range, there is an "ideal" slope, which you can learn more about here. The calibration slope is the tool that the analyzer uses to translate between an electrical signal and a concentration. Thus, the quality of the calibration determines the quality of the measurements made after the calibration is performed. The graphic below depicts the difference between a "good" and a "bad" calibration.
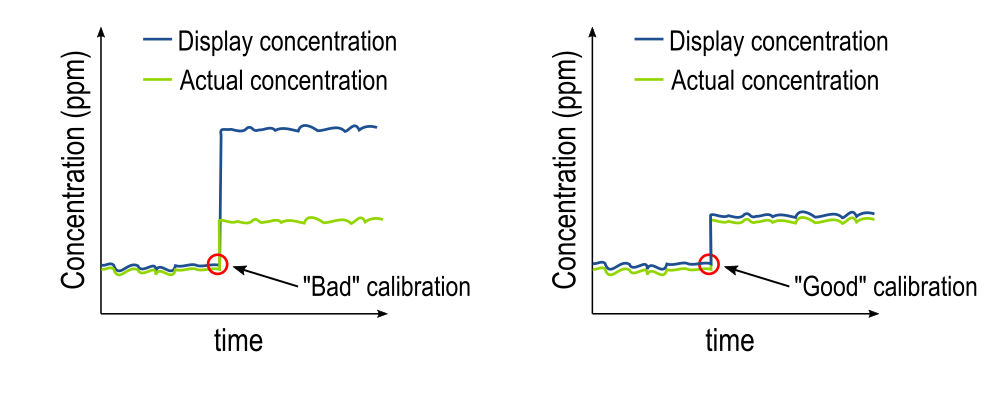
The plot on the left shows the effect of a "bad" calibration, where the reference value input was much higher than the actual disinfectant concentration, which caused a false high reading on the display. The false high reading from the reference measurement could have been caused by many factors, such as sampling errors, chemical interferences, or physical interferences, which are all common when using DPD as a reference. You can learn more about the limitations of DPD as a reference measurement here.
The plot on the right shows the effect of a "good" calibration, where the reference measurement matched well with the actual disinfectant concentration. To achieve a good calibration like the plot on the right, try taking three reference measurements back-to-back and average them together. Always be sure to follow the instructions of your reference measurement system to get the best results.
Calibration is very important to get accurate concentration readings. If you have any questions about calibration or how it works, contact a Kuntze representative or submit a ticket.
Bare Amperometric Sensor vs. Online Colorimetric Sensor Technology
Looking to eliminate the need for reagents for your oxidant measurement? Want a more environmentally-friendly and cost-effective measurement system that doesn't need a hazardous waste stream? Switching from an online colorimetric measurement system gives you these benefits and more. Watch our new video to learn about Kuntze's bare amperometric sensor technology and how it outperforms online colorimetric systems.
Were you looking to compare Kuntze systems to membrane sensor technologies? Click here to learn more.
Why pH Matters in a Free Chlorine Measurement
When chlorine (Cl2) is added to water, hypochlorous acid (HOCl) and the hypochlorite ion (OCl-) are formed. The term "free chlorine" refers to the combination of Cl2, HOCl, and OCl- that is present in solution. HOCl is the predominant biocidal agent, or what "kills" the pathogens that may be present.
All amperometric measurements of free chlorine, including the Kuntze measurement, measure only the presence of HOCl. HOCl is reduced on the measuring electrode, which yields a current that gets translated by the instrument to a free chlorine concentration.
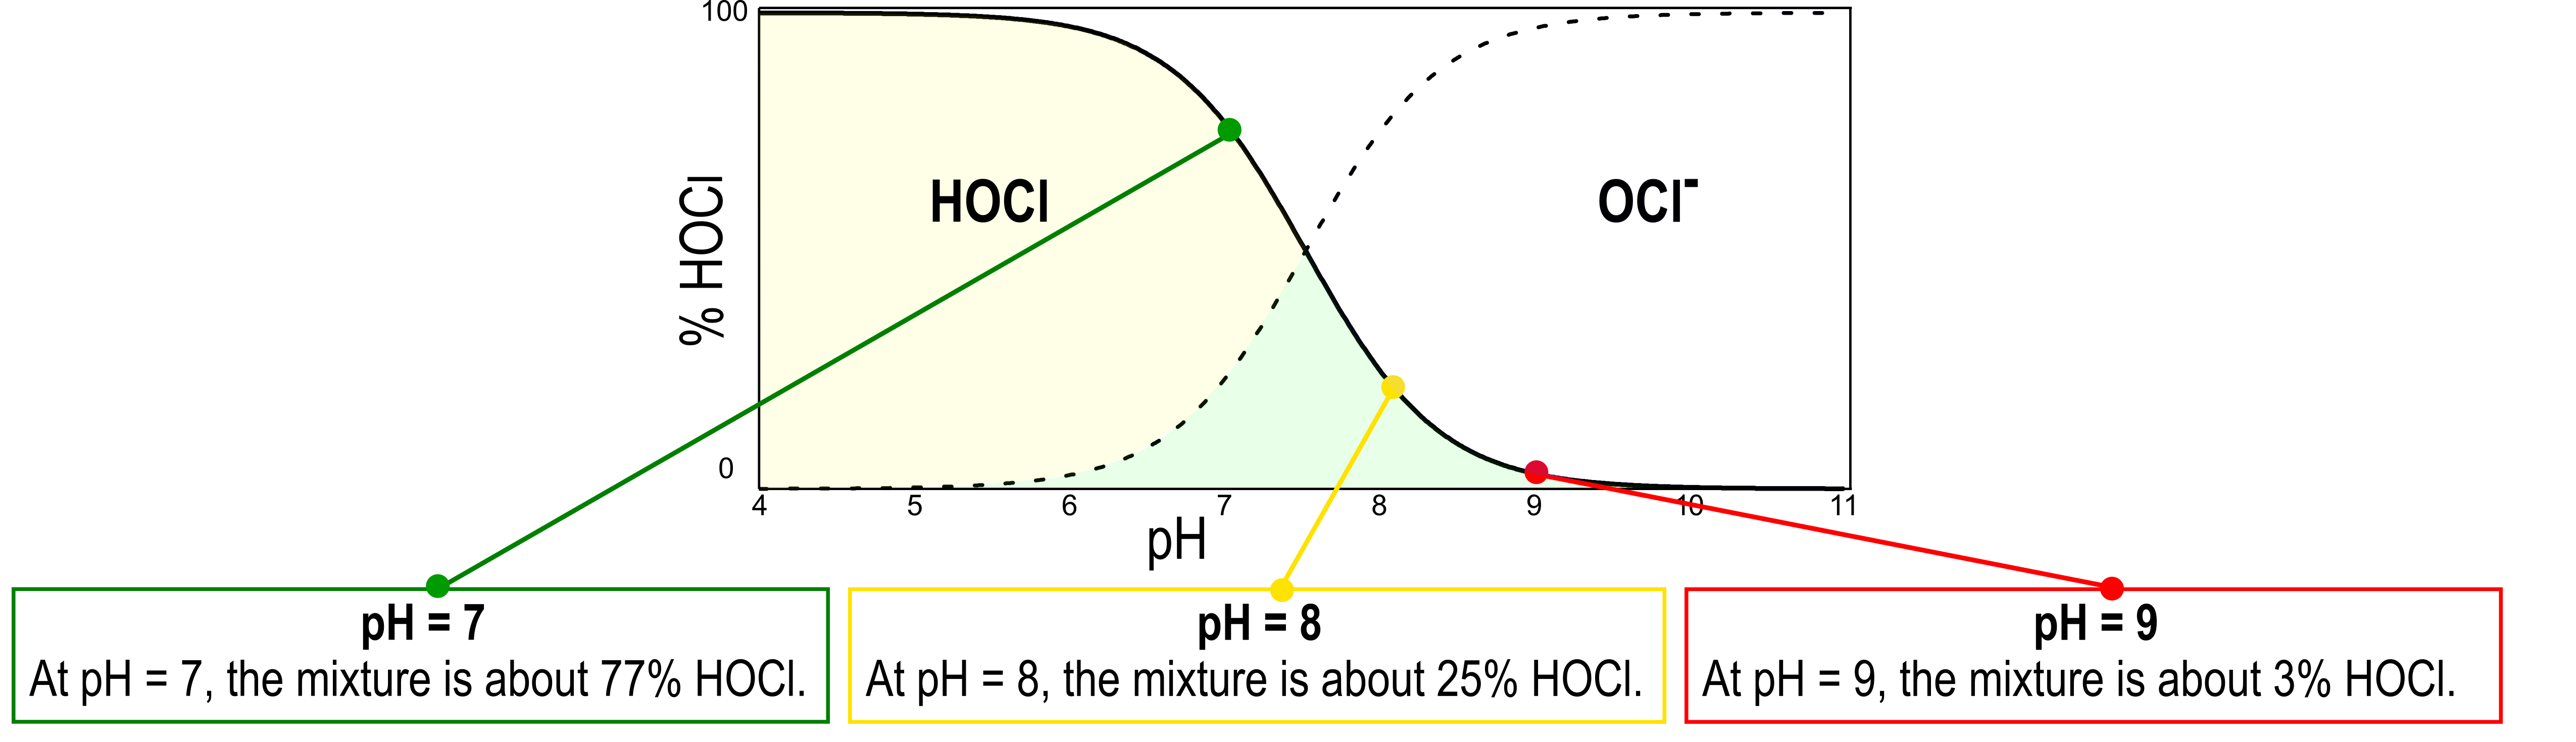
The pH of the system determines what species are present, and in what ratio, shown in the scheme on above. Above pH 8, there is a very small amount of HOCl present in solution, making amperometric detection of free chlorine a more challenging process.
At pH = 7, the mixture is about 77% HOCl, and ideal for the Kuntze measurement. At pH = 8, the mixture is about 25% HOCl. At pH = 9, the mixture is about 3% HOCl. Measurement at this pH will be challenging. Contact a Kuntze representative to discuss possible changes to your measurement system.
Understanding Compliance in Chlorine Measurements
Understanding compliance tolerances is important in assessing the health of your chlorine measurement system. Most systems follow the guidelines set forth in USEPA 334.01, which states that, when compared to a reference sample, "Analyzer reading [must be] within ± 0.1 mg/L or ± 15% (whichever is larger) of grab sample measurement."
Historically, chlorine measurements were made using colorimetric techniques, until amperometric technology became more reliable and popular. Since 2009, the EPA has judged the accuracy of amperometric technology using colorimetric techniques because they are so well defined. USEPA 334.0 builds in tolerances to account for inherent fluctuations and measurement errors that are present in both colorimetric and amperometric technologies.
Determining which set of tolerances you will use depends on your chlorine concentration. To demonstrate this, we simulated some data, shown below. The analyzer signal is shown in blue, while reference measurements are shown by green circles. The error bars on the reference measurements show either ± 15% (left plots) or ± 0.1 ppm (right plots) of the reference value. To select the correct tolerance criterion, we will look at the relative size of the error bars on the circles.
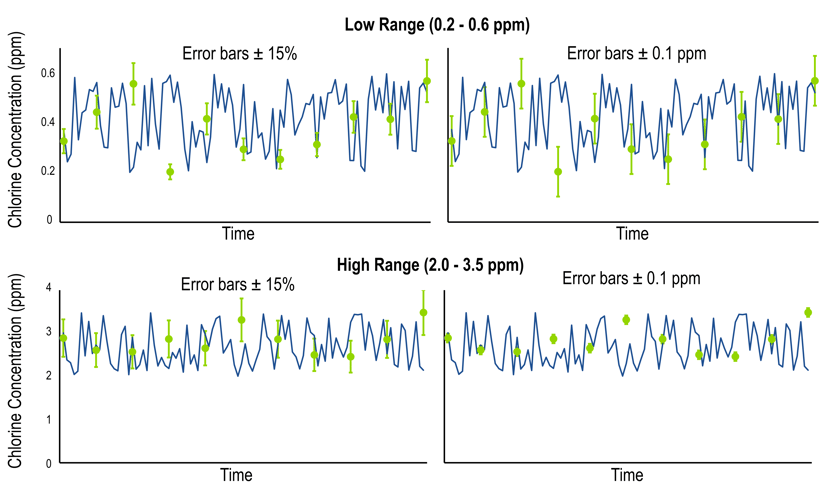
In the low concentration range (shown above), the ± 0.1 ppm criterion is the accepted tolerance because its error bars are larger. In the high concentration range (shown below), the ± 15% criterion is the accepted tolerance because its error bars are larger. If you have questions about compliance and how it applies to your system, please contact a Kuntze representative.